
Investing in the stock market can often be boiled down to understanding two seemingly simple, yet incredibly powerful, financial metrics – the balance sheet and cash flow statement. In our experience getting these wrong leads to a permanent impairment of equity value. It can never be recovered. This is why we don’t invest in companies where this pillar isn’t met.
What does it mean to have a good balance sheet?
Companies over time have become adept at hiding leverage everywhere and it is the job of a good analyst to track this down and form a holistic picture. To do this we look at a plethora of balance sheet areas:
- Net debt to EBITDA or debt to equity ratio
- Pensions
- Off balance sheet arrangements including associates and minorities
- Debt maturity profiles
- Derivative instruments
- Put/Call structures related to acquisitions
- Working capital
- Provisions e.g., decommissioning, warranties etc.
- Pending legal action and related liabilities
Our favorite saying is – “it’s always in the footnotes and under the other category”.
For example, we chose to avoid investing companies like GlaxoSmithKline which have several hidden liabilities including (all metrics from the 2022 annual report):
- Contingent considerations worth £5.9bn.
- Put options from historic deals of £1bn.
- Pension obligations of almost £14.5bn gross (a deficit of £1.4bn).
All of these need to be added to the high £17.2bn of net debt. This is not to mention product liability risks not fully reflected yet in the balance sheet of the company.
Often balance sheets need to be considered in combination with the operations of the business. Cleveland Cliffs (CLF), the steel company, is on the surface an attractive reshoring investment but one we have avoided because of the company’s penchant for taking on debt at very inopportune points to fund its capital-intensive business. It is dangerous as the company has high exposure to the cyclical automotive sector and also falls foul of political risks related to tariffs.
Farfetch (FTCH) is another example of a stock that we decided to sell on deeper inspection of the balance sheet. The company had issued convertible debt that together created a rather large gross debt position (at H1 2023 estimated at $1.4bn). Seasonality exposed weakness, with cash at its lowest point at the half-year. One warning sign that the debt of FTCH at that point was trading at 53cts on the dollar, suggesting further issues.
What is a good cash flow profile?
Cash flow is the life blood of a business and the key driver of shareholder value. This is why it is important to form a comprehensive picture of a business’ cash flow statement - accounting working capital, capital expenditure, both intangible and tangible, and even share based compensation, a cost that evades the cash flow statement but needs to be included.
Below is a snapshot of one of our headline models – this one for Airbus. It shows how earnings waterfall into cash flow. This profile is attractive. Airbus has seen improving cash conversion which will bring the company to net cash by 2025E. There is therefore considerable headroom for the company to keep investing or return capital to shareholders.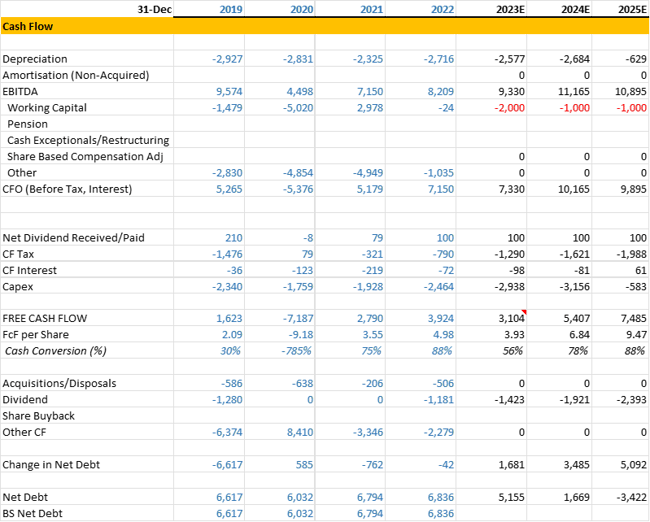
On the flipside a firm like Teledoc, which might seem like a good investment for our MNTL strategy, flashed several warning signs on cash conversion. First, the company pursued revenue growth with no care for the incremental cash flow margins of this growth. They touted the classic Adjusted EBITDA metric which excluded share-based compensation. On this measure margins seemed a healthy 13.1% in 2023. However, if one looked at cash flow statement and adjusted for share-based compensation ($200m in 2023), the FcF margin is negative. The company’s use of cash is even worse, crowned by the value destroying $18.5bn cash and stock deal for Livongo at peak valuations in October 2020.
Conclusion
In summary, our second pillar looks to weed out stocks that have weak balance sheets and poor cash flow profiles. This is important to avoid the risk of permanent loss of capital these types of firms carry.
