
By clicking below you acknowledge that you are navigating away from temaetfs.com and will be connected to temafunds. Tema Global Limited manages both domains. Please tack note of Tema's privacy policy, terms of use, and disclosures that may vary between sites.
Invest directly by choosing one of the brokers below

Get in Touch
THRU
Tema Commodity Infrastructure ETF
Invest in What Keeps Commodities Moving
Why Invest in THRU?
First-of-Its-Kind ETF
The first and only ETF providing exposure to real assets across the full commodity infrastructure value chain
Supercycle Positioning
The world is investing more to extract and transport commodities, fueling a potential supercycle
Lower Volatility
Targets companies with durable cash flows that may offer resilience to macroeconomic headwinds and a hedge against inflation
Portfolio Highlights

Energy Transfer (ET) is a U.S. energy infrastructure company operating one of the largest pipeline networks in the country. Its systems move natural gas, crude oil and natural gas liquids from major producing basins to Gulf Coast markets.

GTT (GTT FP) is a French engineering company that designs cryogenic membrane containment systems used to transport and store liquefied natural gas. Its technology is licensed to shipyards building LNG carriers and storage tanks worldwide.

Epiroc (EPIB SS) is a Swedish manufacturer of mining and infrastructure equipment, including underground drill rigs and rock excavation tools. Epiroc also provides automation technology, electrified machines and aftermarket services to mining customers globally.
Portfolio Holdings are subject to change. Review current holdings below.
Fund Overview
Fund Details
As of October 21, 2026
Ticker
THRU
CUSIP
87975E677
Inception Date
10/21/26
Total Expense Ratio
0.75%
AUM
$25
Primary Exchange
TXSE
Shares Outstanding
1
# of Holdings
34
Portfolio Manager
Jake Sperber
Fund Summary
The Tema Commodity Infrastructure ETF (THRU) invests in companies that enable the global flow of commodities, from physical networks and logistics to equipment, services, and exchanges.
Portfolio Breakdown
Top 10 Holdings
As of October 22, 2026
Company
% of Nav
ENERGY TRANSFER LP
5.94%
CHENIERE ENERGY INC
5.88%
SLB LTD
4.57%
EPIROC AB
4.53%
KINDER MORGAN INC
4.52%
GAZTRANSPORT ET TECHNIGAZ SA
4.48%
WILLIAMS COS INC/THE
4.08%
PEMBINA PIPELINE CORP
4.01%
GLENCORE PLC
4.00%
WESTERN MIDSTREAM PARTNERS LP
3.97%
Country Breakdown
Cash & Cash Equivalents
0.30%Others
99.70%Industry Breakdown
Others
99.70%Cash & Cash Equivalents
0.30%ETF Characteristics
As of October 21, 2026
Return on Equity
Measures how efficiently companies generate profit relative to shareholder equity. Calculated as aggregated earnings divided by aggregated average book value over the year.
13.0%
Median Market Cap
The midpoint market capitalization among all companies held in the ETF. Half of the holdings have a market cap above this figure, and half below. It gives a snapshot of the typical company size in the fund, without being skewed by a few very large or very small positions.
$
34,166
M
Price-to-Earnings (P/E)
The aggregated price of the ETF's holdings divided by aggregated expected earnings of holdings.
11.7x
Price-to-Book Value (P/BV)
The aggregated price of the ETF's holdings divided by aggregated forecast book value of holdings.
1.5x
Price-to-Sales (P/S)
The aggregated price of the ETF's holdings divided by aggregated expected sales of holdings.
1.2x
Risk Statistics
As of September 30, 2026
Beta vs. S&P 500
Measures how the ETF's daily returns move relative to stated index (S&P 500). A beta of one means it moved one for one. This measure is a one-year raw beta.
--
Beta vs. Nasdaq 100
Measures how the ETF's daily returns move relative to stated index (Nasdaq 100). A beta of one means it moved one for one. This measure is a one-year raw beta.
--
Beta vs. MSCI-EAFE
Measures how the ETF's daily returns move relative to stated index (MSCI EAFE). A beta of one means it moved one for one. This measure is a one-year raw beta.
--
Beta vs. MSCI Emg. Mkts.
Measures how the ETF's daily returns move relative to stated index (MSCI Emerging Markets). A beta of one means it moved one for one. This measure is a one-year raw beta.
--
Standard Deviation
An annualized measure of how much the ETF's daily total returns have varied over the past year.
--
- Performance
- Distributions
- Premium / Discount
Prices & Performance
{}
As of
Sep 30, 2026
- Sep 30, 2026
THRU
3 months
1 Year
3 Years
5 Years
Since inception
NAV
Market Price
Performance data quoted represents past performance and is no guarantee of future results. Investment return and principal value of an investment will fluctuate so that an investor’s shares, when redeemed, may be worth more or less than the original cost. Current performance may be lower or higher than the performance data quoted. Returns for periods of less than one year are not annualized.
The market price returns are based on the official closing price of an ETF share or, if the official closing price isn’t available, the midpoint between the national best bid and national best offer (“NBBO”) as of the time the ETF calculates current NAV per share, and do not represent the returns you would receive if you traded shares at other times. NAVs are calculated using prices as of 4:00 PM Eastern Time. The first trading date is typically several days after the fund inception date. Therefore, NAV is used to calculate market returns prior to the first trade date because there is no bid/ask spread until the fund starts trading.
Distributions
Record Date
Ex-Date
Payable Date
Total Distribution
Income
0
Premium/Discount
Сhart
Table
Days Traded at Nav
Days Traded at Premium
Days Traded at Discount
THRU NAV / Market Price
NAV$25.15
Daily Change
Market Price$25.15
Daily Change
Premium/Discount0.00%
30-Day Median Bid/Ask Spread%
As of October 21, 2026

Portfolio Manager
Jake Sperber
Jake is an Investment Partner and Head of Commodities at Tema ETFs. He has over 20 years of institutional investment experience primarily focused on the energy, infrastructure, and commodity sectors. He most recently spent 11 years at Nuveen as a portfolio manager and lead analyst for energy infrastructure equities within a $10 billion global real assets strategy. Previously, Jake spent 9 years in leadership roles on Cargill's commodity trading desk. Jake holds both an MA in Economics and an MBA from George Washington University and a BA in History from the University of Minnesota.
Using THRU in a Portfolio
Investment Style Box
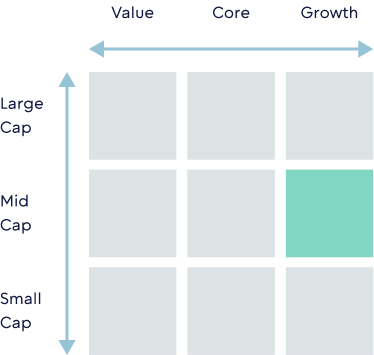
Source: Tema. The investment style Box reveal’s a fund’s investment strategy by showing its investment style and market capitalization based on the fund’s portfolio holdings.
Potential Portfolio
Equity Allocation
3-5%
Equity Satellite


VOLT ETF

Equity core
Where could a position be funded from?
- From a mid cap position due to VOLT’s mid-cap growth style.
- We believe the quality bias makes for a strong alternative or compliment to a broad index approach.
- Mid-cap businesses typically under-represented in a portfolio, despite having a historically positive effect on risk-adjusted returns.
How to Invest



*Neither Tema ETFs LLC nor undefined ETF are affiliated with these financial services firms. Their listing should not be viewed as a recommendation or endorsement.
Related Research & Insights
Stay informed with our latest research, insights, and market analysis to make better investment decisions.
The Data Center Boom and the Race for Power
Discover how surging data center demand is creating an urgent need for new power infrastructure.
How to Invest in Anthropic Pre-IPO
Addressing one of this fall's most frequent questions: How can investors gain exposure to Anthropic ahead of its widely anticipated IPO?
What to Expect When You’re Expecting… A Mid-Term Election
Learn what the 2026 midterms could mean for AI regulation, U.S. manufacturing, healthcare, and the investment opportunities that follow.
Subscribe for Updates
Risk Information
Carefully consider the Fund’s investment objectives, risk factors, charges and expenses before investing. This and additional information can be found in the Fund’s prospectus or summary prospectus, which may be obtained by visiting www.temaetfs.com/THRU. Read the prospectus carefully before investing.
Investing involves risk including possible loss of principal. There is no guarantee the fund's investment strategy will be successful.
Sector Focus Risk: The Fund may invest a significant portion of its assets in one or more sectors and thus will be more susceptible to the risks affecting those sectors than funds that have more diversified holdings across a number of sectors. The Fund anticipates that it may be subject to some or all of the risks described below.
Energy Sector Risk: There are a number of factors that could affect performance of the energy sector, including changes in commodity prices. For example, many regions that produce fossil fuel or in which pipes for transporting fossil fuel are located are politically volatile and conflicts in these regions could result in spikes in oil, gas and coal prices. Other factors include (but are not limited to) energy conservation efforts, advances in renewable energy and the transition to clean energy and the costs of such technology, costs of cleaning up accidents and civil liabilities, taxes, governmental regulation on privatization, pricing and supply and other intervention. Some of the securities in the energy sector may be less liquid than securities in other sectors which may make it more difficult for the Fund to purchase or sell such securities. As a result of the above risks, the Fund’s investments can be adversely affected and the value of your investments may go up or down.
Industrials Sector Risk: The prices of companies in the industrials sector may be affected by supply and demand both for their specific product or service and for industrials sector products in general. Government regulations, labor relations, world events, economic conditions and taxes may affect the performance of companies in the industrials sector. Companies in the industrials sector may be adversely affected by product liability claims, liability for environmental damage and changes in exchange rates. The industrials sector may also be adversely affected by changes or trends in commodity prices, which may be influenced or characterized by unpredictable factors. As a result of the above risks, the Fund’s investments can be adversely affected and the value of your investments may go up or down.
Materials Sector Risk: Investment in companies in the materials sector could be adversely affected by (without limitation) the following factors: commodity price volatility, exchange rates, import controls, increased competition, depletion of resources, consumer demand for greener products, technical progress, labor relations, interest rates, government regulations, and taxes. Also, companies in the materials sector are at risk of environmental damage and product liability claims. Production of materials may exceed demand as a result of market imbalances or economic downturns, leading to poor investment returns.
Tema ETFs LLC serves as the investment adviser to Tema Commodity Infrastructure ETF (the “Fund”), and Tidal Investments LLC serves as a sub-adviser to the Fund. The Fund is distributed by Vigilant Distributors, LLC, which is not affiliated with Tema ETFs LLC nor Tidal Investments LLC. Check the background of Vigilant Distributors, LLC on FINRA’s BrokerCheck.